Which treatment combination gives the highest yield?
A factorial field trial: three fertilizers, two irrigation systems, four blocks. The interaction is the interesting part, and the assumption checks decide which post-hoc test you are allowed to report.
Fictional data. The dataset on this page is synthetic — generated to show what the app does. It describes no real study, customers, patients or people, and the results are not findings.
The same three questions, answered in the app
Every panel below is a real result from StatInsight on the demo dataset — the text, the numbers, the chart and the report paragraph exactly as they appear on screen and in the Word export. The data behind them are fictional.
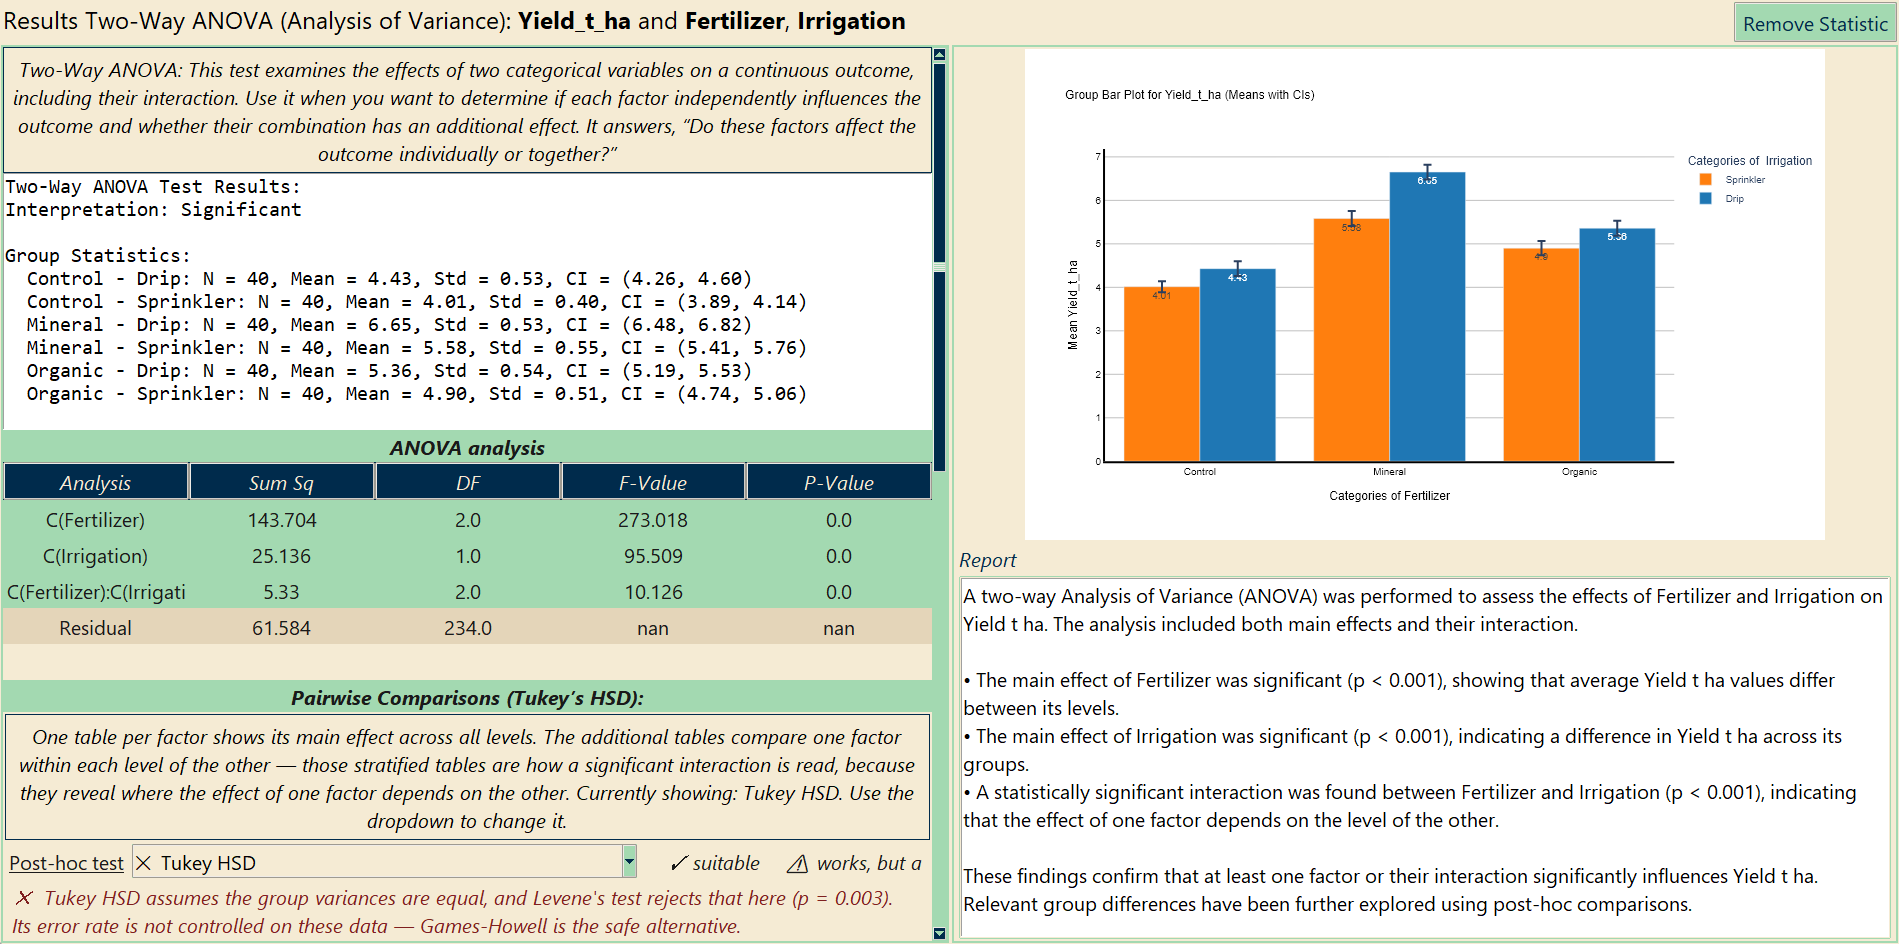
Do fertilizer and irrigation interact?
Yield with two factors. The ANOVA table lists both main effects and the interaction; the grouped-means plot shows why it is significant: mineral fertilizer gains most from drip irrigation. Below, one pairwise table per factor and stratified tables for the interaction.
- Fertilizer F = 273, irrigation F = 95.5, interaction F = 10.1 — all p < 0.001
- Mineral + drip: 6.65 t/ha, control + sprinkler: 4.01 t/ha
- Levene’s test fails, so StatInsight marks Tukey HSD red and points to Games-Howell — switch it in the dropdown
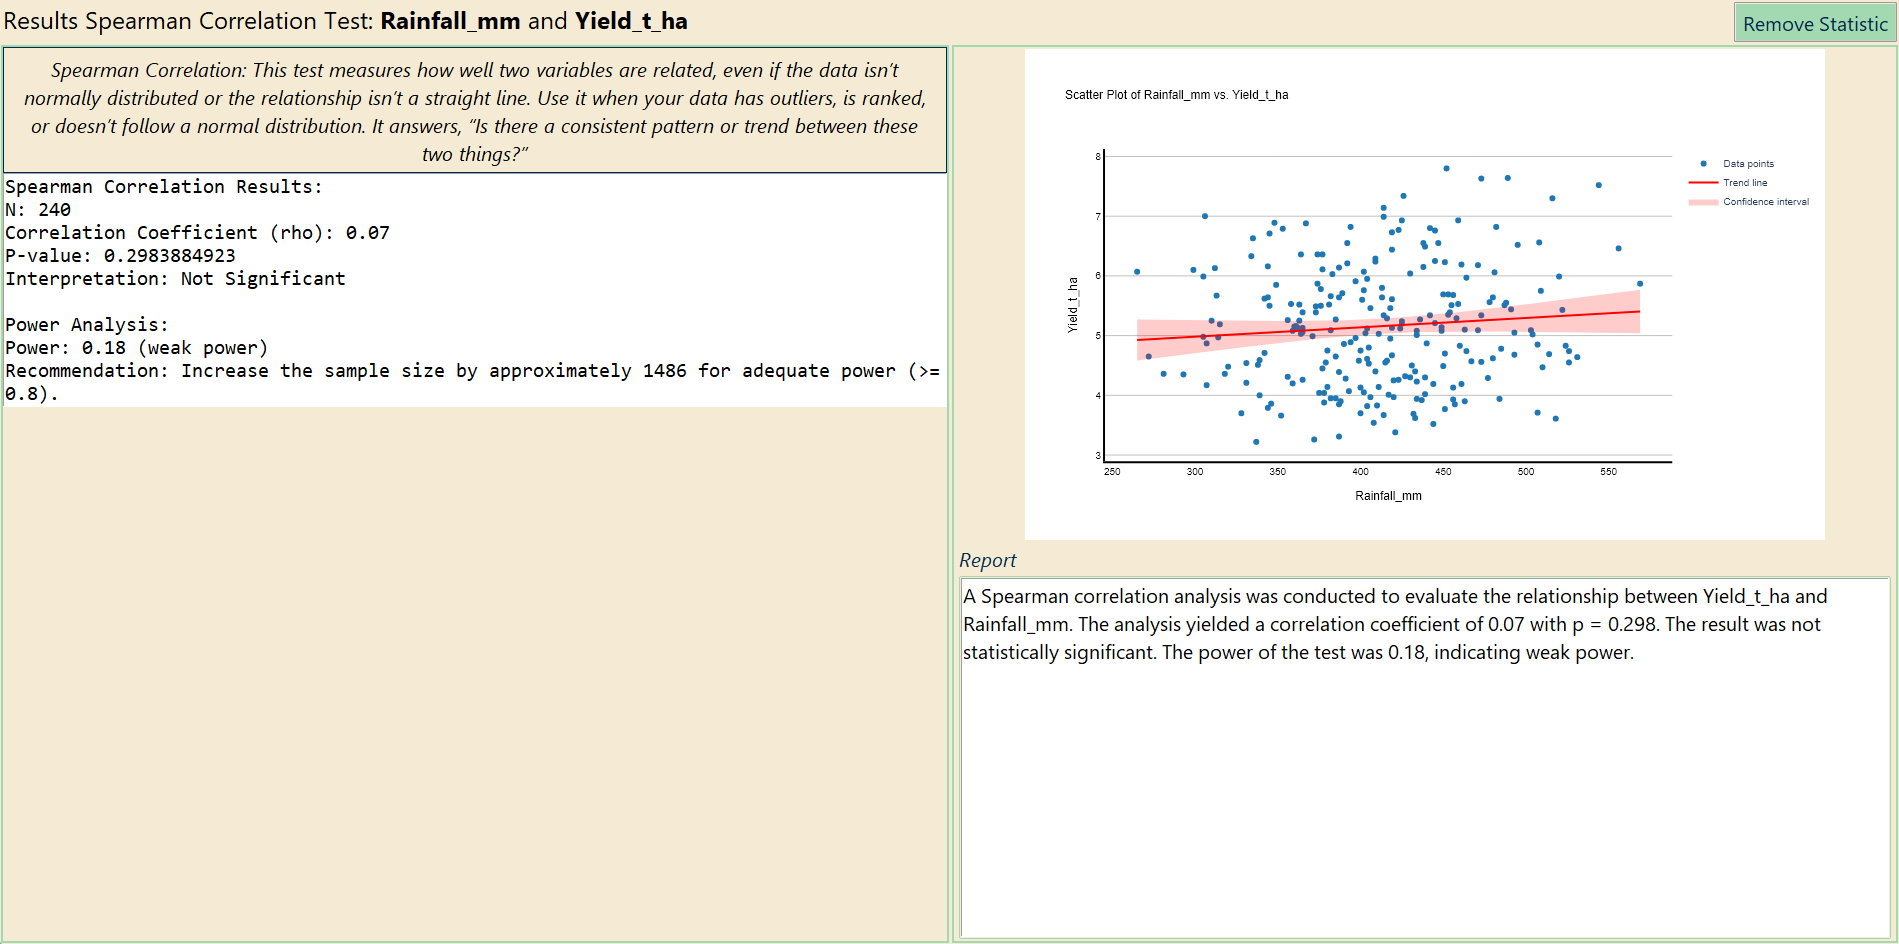
Does rainfall still explain yield when plots are irrigated?
Yield is not normally distributed, so Spearman is the green button. A null result, reported honestly: ρ = 0.07, p = 0.30, and the panel says what sample size would have been needed to detect an effect this small. Irrigation, not rainfall, drove the yield in this trial.
- Scatter plot with trend line and confidence band
- Pearson and Theil-Sen are the neighbouring buttons
- Partial correlation: rainfall and yield controlling for soil pH
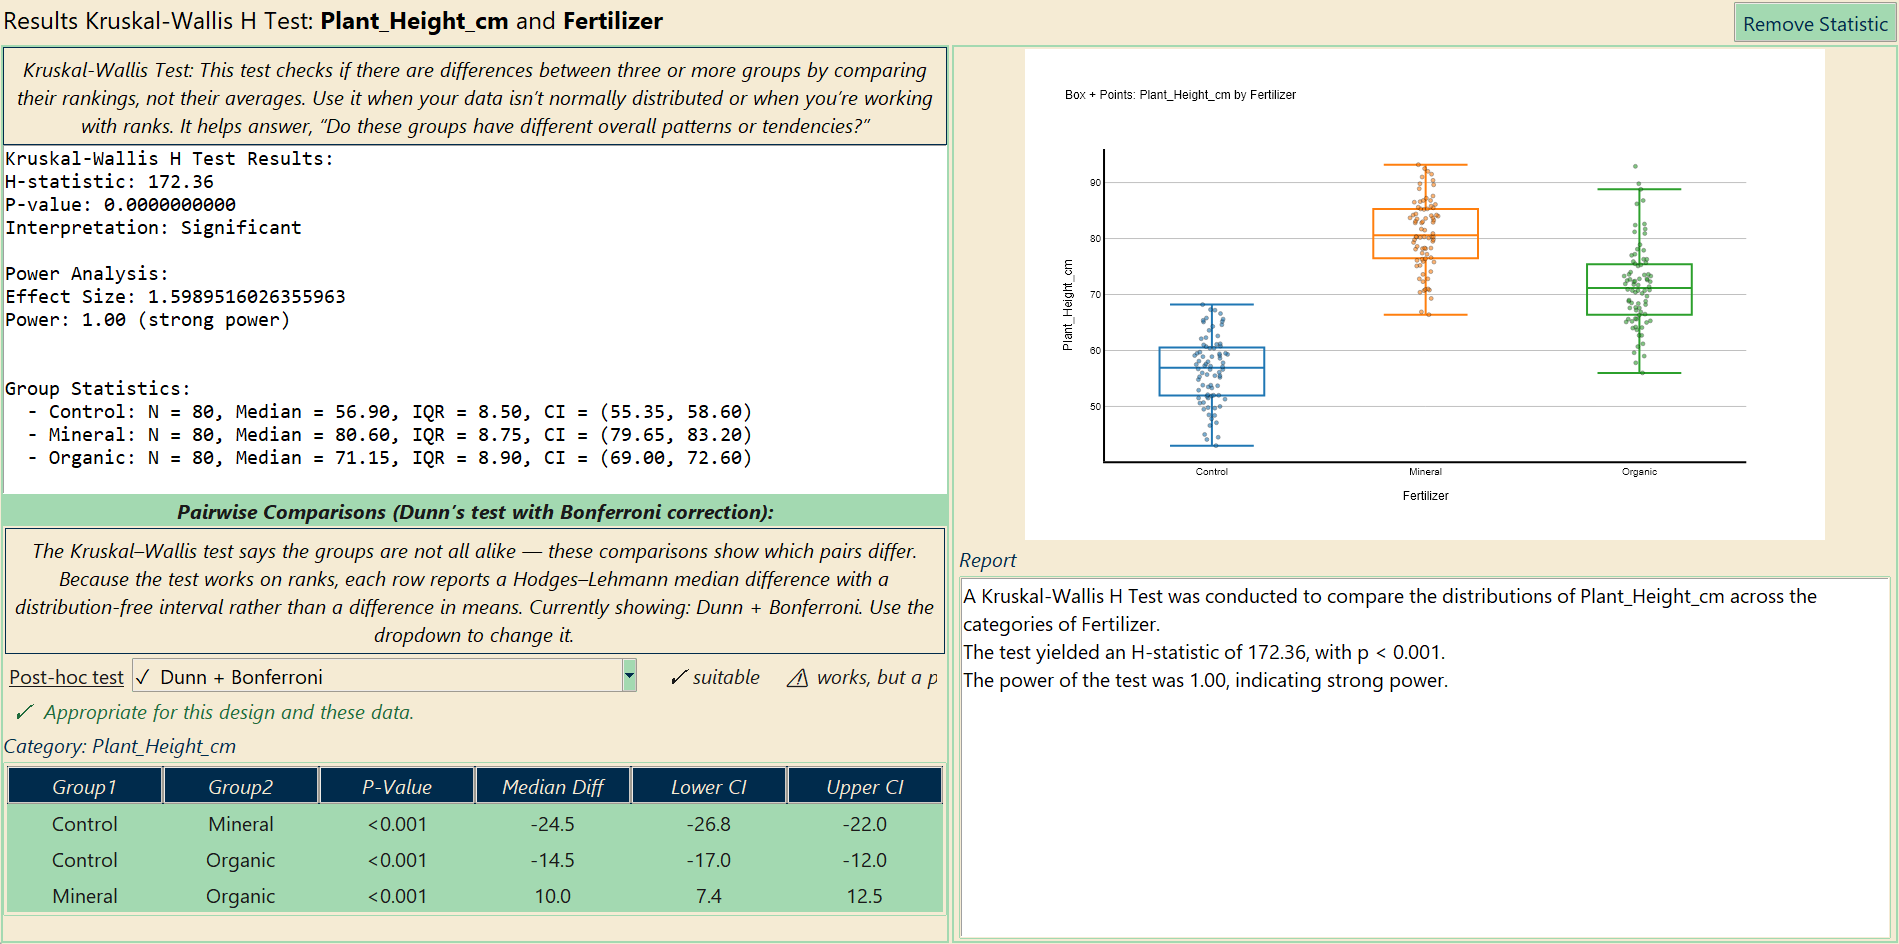
Plant height by fertilizer, when the data are not normal?
Kruskal-Wallis with medians and interquartile ranges, then Dunn’s test with Bonferroni correction underneath — every pair with a Hodges-Lehmann difference and its interval. Conover-Iman and Nemenyi are in the same dropdown.
- H = 172, p < 0.001; medians 56.9 / 71.2 / 80.6 cm
- All three pairs differ (p < 0.001)
- Box + points, raincloud or ECDF per group: switch the figure without re-running
Fertilizer × irrigation trial
240 plots · 10 variables · fictional, computer-generated for this page · free to use in teaching and testing
A 3 × 2 factorial design in four blocks: control, organic and mineral fertilizer under drip or sprinkler irrigation. Yield, plant height, soil pH, rainfall and disease incidence per plot.
| Column | Type | Meaning |
|---|---|---|
Fertilizer | categorical | Control, Organic, Mineral |
Irrigation | binary | Drip or Sprinkler |
Yield_t_ha | continuous | Yield in tonnes per hectare |
Plant_Height_cm | continuous | Height at harvest |
Soil_pH, Rainfall_mm, Nitrogen_kg_ha | continuous | Plot conditions |
Disease_Incidence | binary | 1 = disease observed |
Block | categorical | Four blocks |
Reminder: every number, table and chart on this page comes from a fictional, computer-generated dataset. They demonstrate the tool, not a real result.
Also in this dataset
- Disease incidence by irrigation: chi-square
- Yield by block: is there a field gradient? One-way ANOVA
- Soil pH and yield: Spearman, or a quadratic look with the scatter + trend line
- Publication figure: interaction plot and pairwise table exported to Word, or PDF/SVG from the plot editor
Other fields: PsychologyEducationCustomer analyticsMarketingHR & people analytics