Which teaching method works best?
Three classes, a pre-test, a final exam and the question every evaluation ends with. StatInsight runs the comparison, chooses the post-hoc test that fits the variances, and adjusts for where students started.
Fictional data. The dataset on this page is synthetic — generated to show what the app does. It describes no real study, customers, patients or people, and the results are not findings.
The same three questions, answered in the app
Every panel below is a real result from StatInsight on the demo dataset — the text, the numbers, the chart and the report paragraph exactly as they appear on screen and in the Word export. The data behind them are fictional.
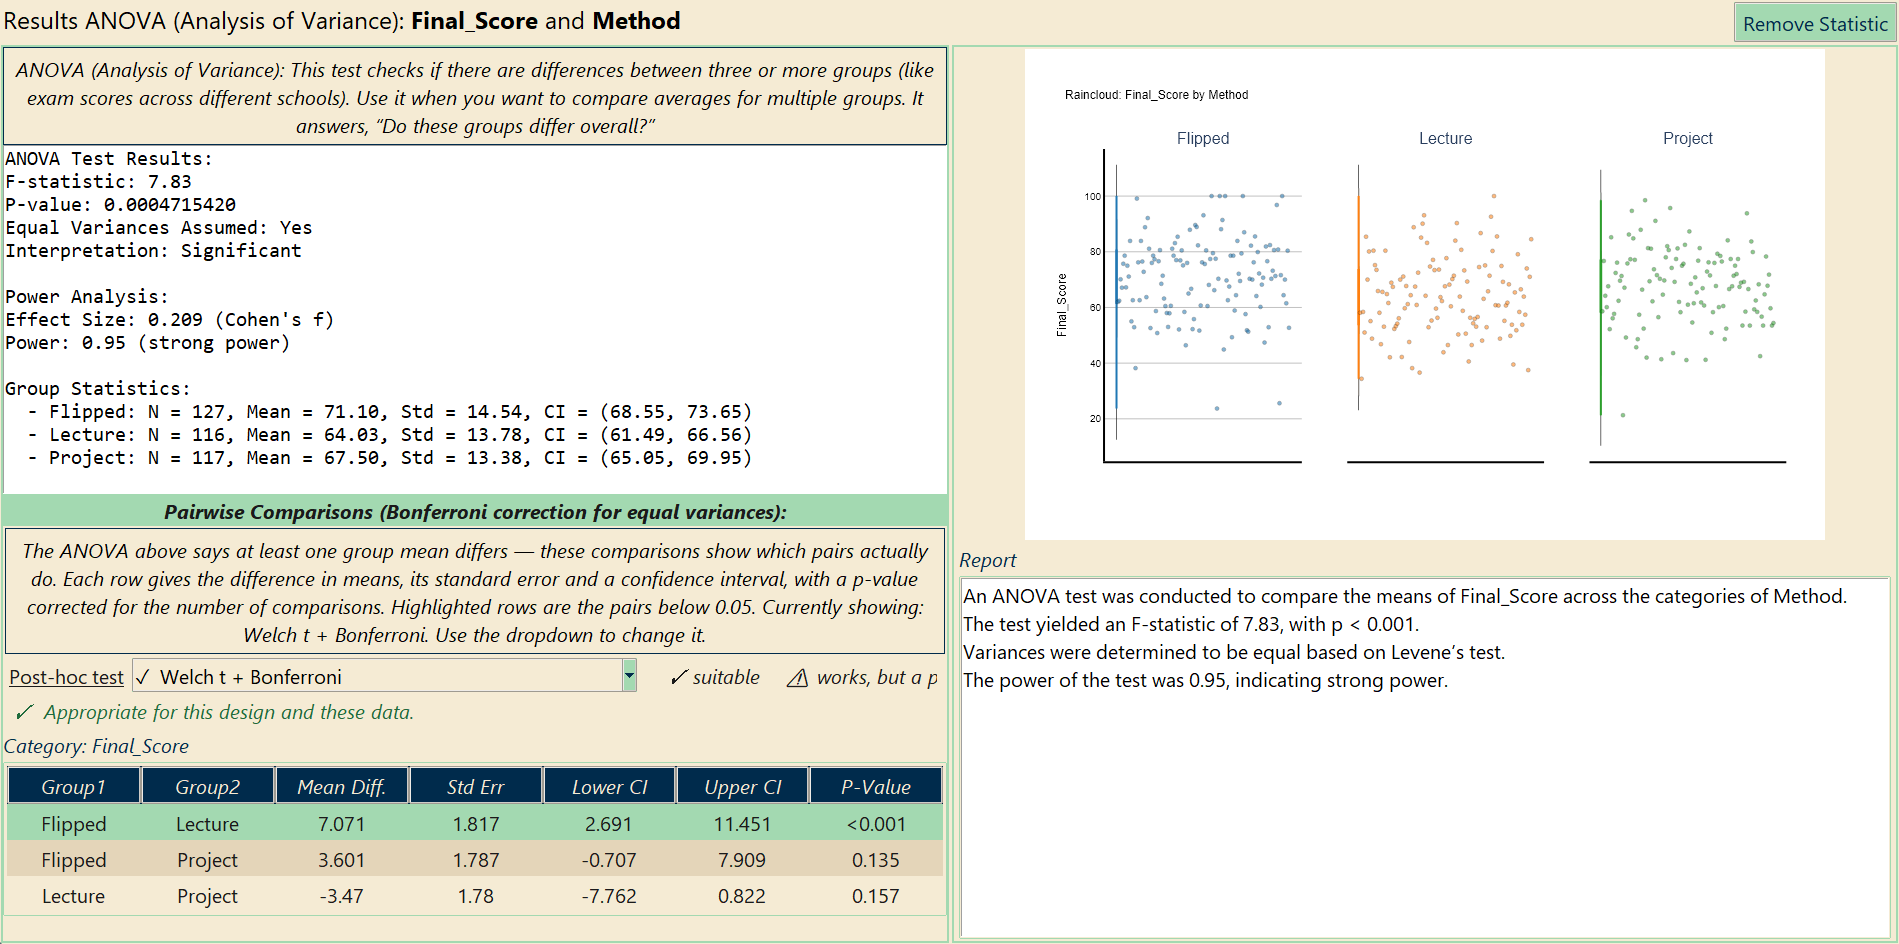
Do final scores differ between the three methods?
One-way ANOVA on Final_Score by Method. Levene’s test passes, so the pairwise table underneath uses Welch t-tests with Bonferroni correction — and the dropdown above it offers Tukey HSD, Games-Howell, Scheffé and the rest, each marked green, yellow or red for these data.
- F(2, 357) = 7.83, p < 0.001; Flipped 71.1, Project 67.5, Lecture 64.0
- Flipped vs. lecture: +7.1 points, p < 0.001; the other two pairs are not significant
- Effect size (Cohen’s f) and power are in the same panel
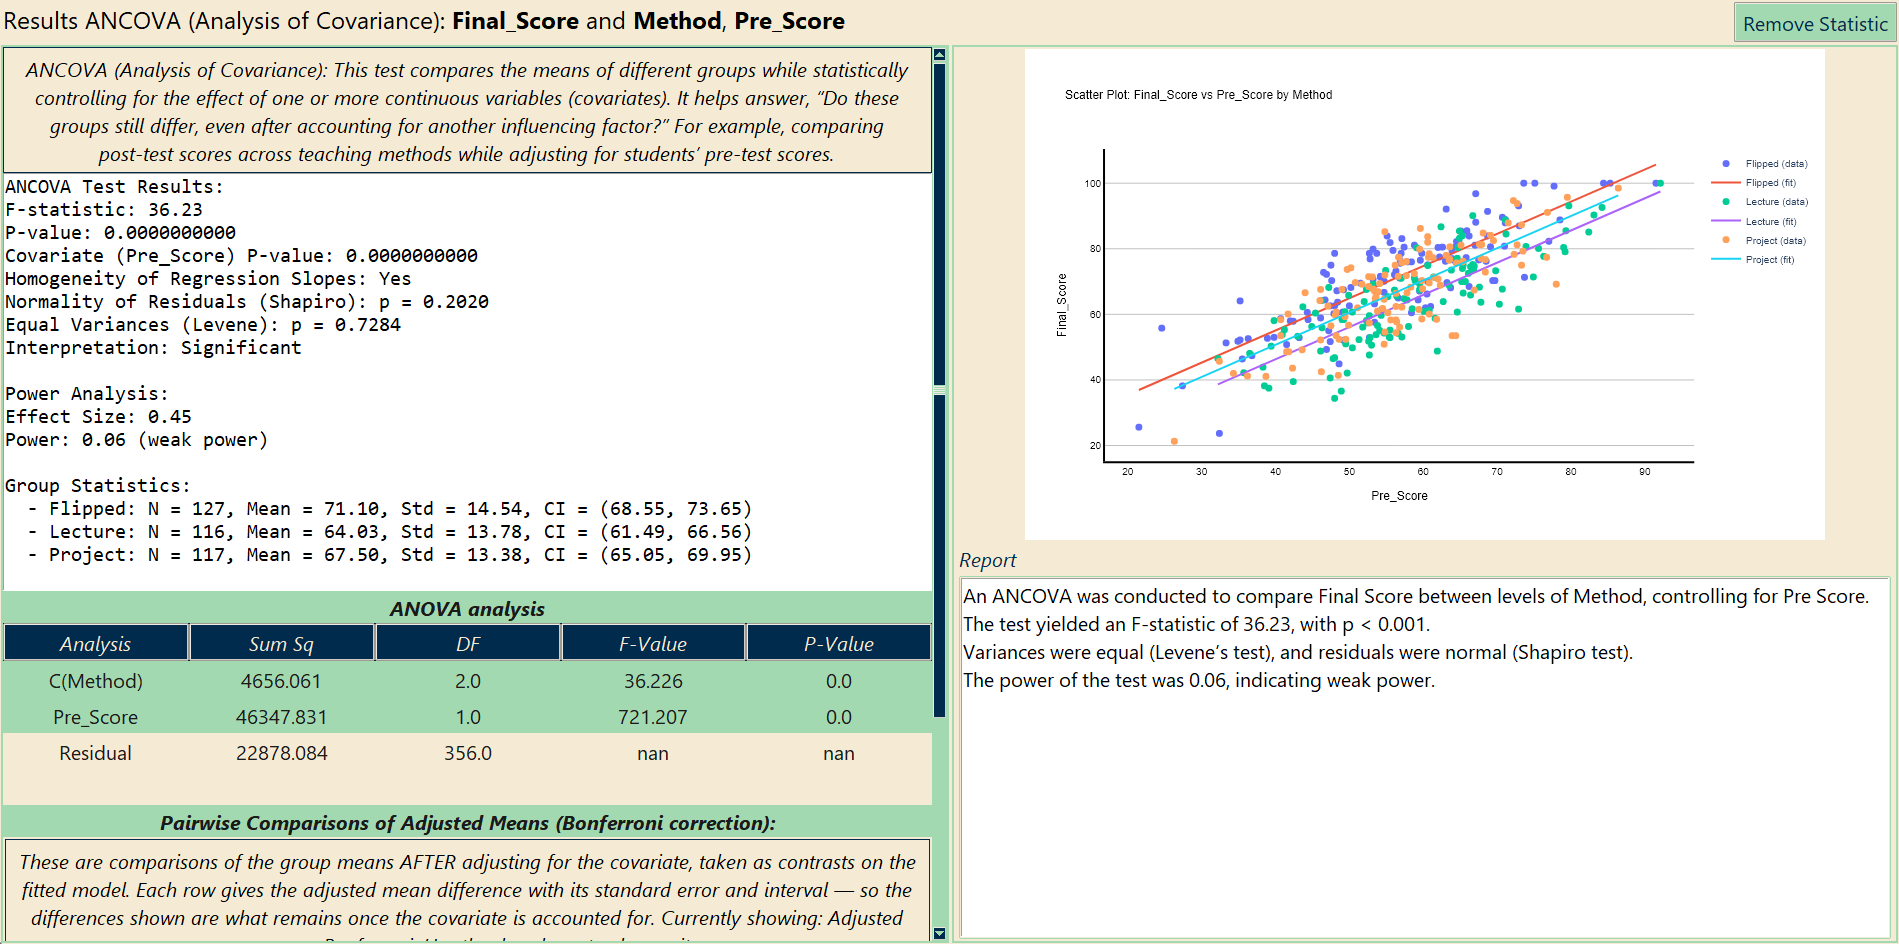
Does the difference survive adjusting for the pre-test?
Students did not start equal. ANCOVA compares the methods at the same pre-test score: pick the covariate in a third box and the result reports the homogeneity-of-slopes check, residual normality, the adjusted means and their pairwise contrasts.
- Method F = 36.2, p < 0.001 after adjusting for Pre_Score
- Slopes homogeneous, residuals normal, variances equal — each check is printed, not assumed
- Adjusted-means plot with one regression line per method
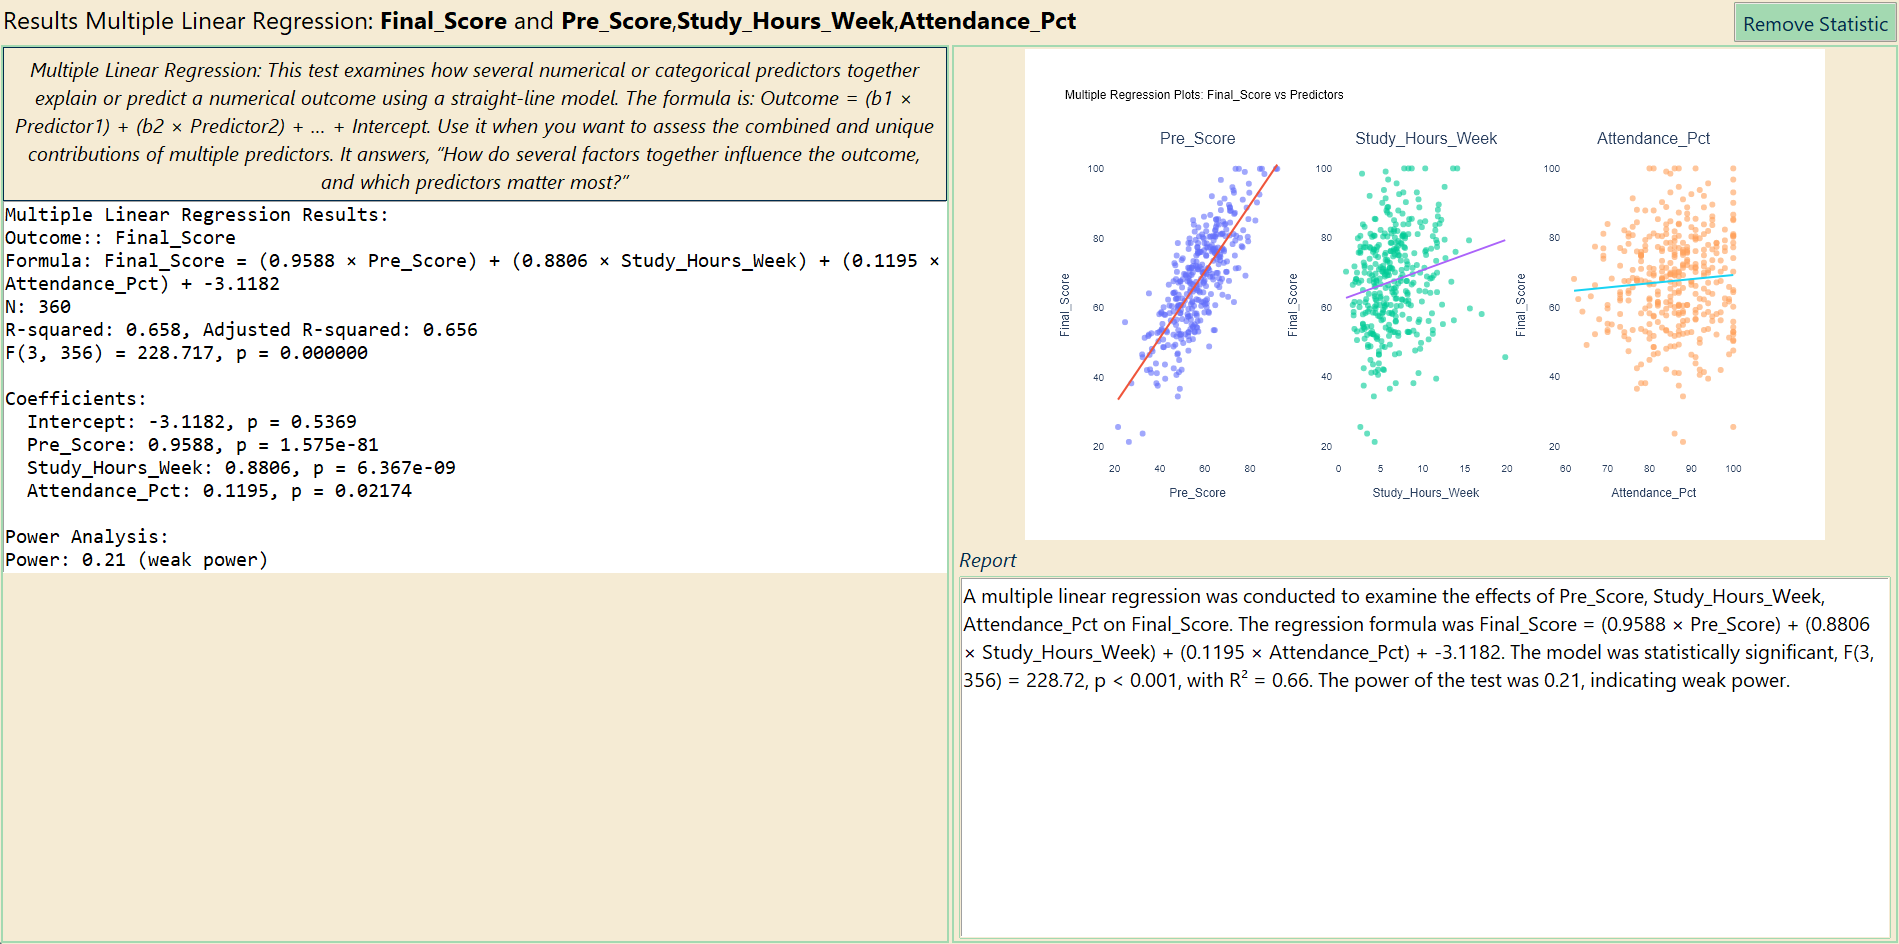
How much do study hours and attendance add?
Final score on pre-test, weekly study hours and attendance. Coefficients, p-values, R² and the formula are written out, and the report paragraph is phrased the way a results section reads.
- R² = 0.66; each study hour per week is worth +0.9 points (p < 0.001)
- Attendance adds +0.12 per percentage point (p = 0.02)
- Categorical predictors (Method, School) can go in the same model
Three teaching methods
360 students · 11 variables · fictional, computer-generated for this page · free to use in teaching and testing
Students in three schools were taught the same unit by lecture, flipped classroom or project work. Pre-test and final score, weekly study hours, attendance, homework completion and pass/fail.
| Column | Type | Meaning |
|---|---|---|
Method | categorical | Lecture, Flipped, Project |
Pre_Score, Final_Score | continuous | Test scores, 0–100 |
Score_Gain | continuous | Final minus pre-test |
Study_Hours_Week, Attendance_Pct, Homework_Completion_Pct | continuous | Effort measures |
Passed | binary | Final ≥ 60 |
School, Gender | categorical | Grouping variables |
Reminder: every number, table and chart on this page comes from a fictional, computer-generated dataset. They demonstrate the tool, not a real result.
Also in this dataset
- Pass rate by method: chi-square with a mosaic plot
- Did all three schools benefit equally? Two-way ANOVA Method × School with the interaction plot
- AutoPrediction: which of the effort measures predicts passing?
- Report everything to Word with one click, figures included
Other fields: PsychologyCustomer analyticsMarketingAgriculture & biologyHR & people analytics