Did variant B really convert better?
A conversion rate is a proportion, engagement is skewed, and “it looks higher” is not a result. StatInsight picks the right test for each, reports the effect and the power, and gives you a figure for the slide.
Fictional data. The dataset on this page is synthetic — generated to show what the app does. It describes no real study, customers, patients or people, and the results are not findings.
The same three questions, answered in the app
Every panel below is a real result from StatInsight on the demo dataset — the text, the numbers, the chart and the report paragraph exactly as they appear on screen and in the Word export. The data behind them are fictional.
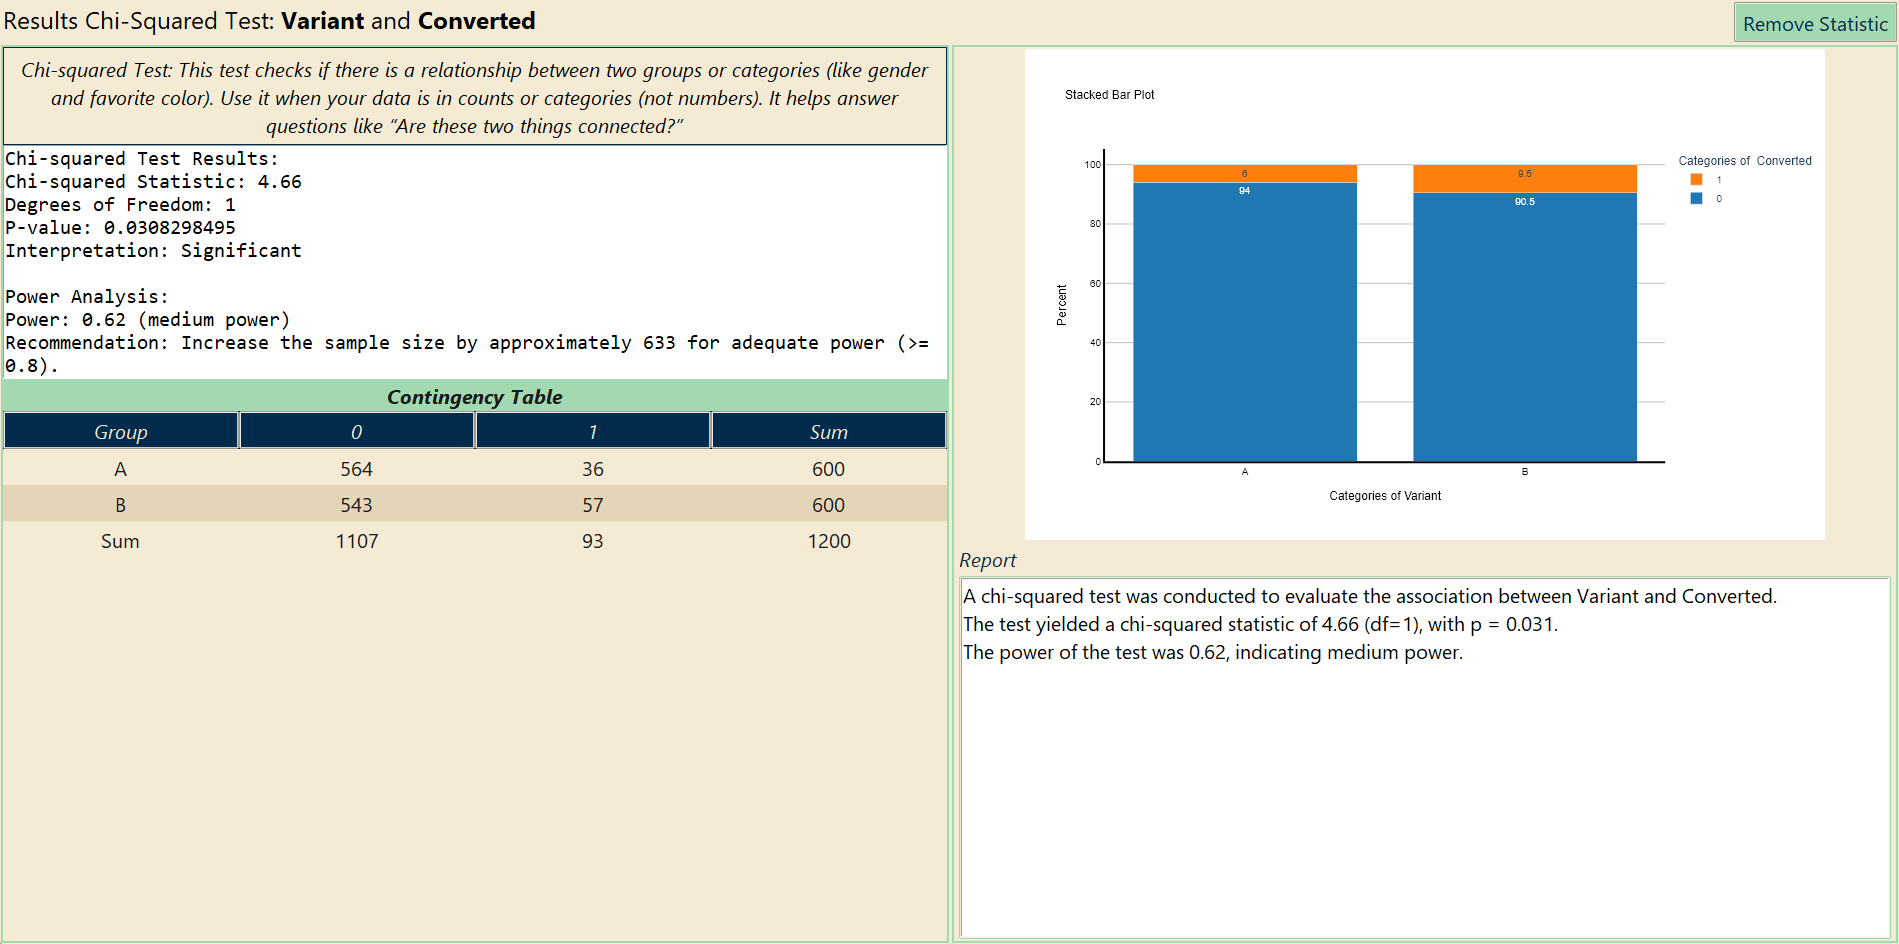
Is the lift in conversion rate real?
Variant and Converted — two categorical columns — give the contingency table, the chi-square statistic and a stacked bar of the conversion shares. The power estimate tells you whether the test could have seen a smaller lift.
- A 6.0 % vs. B 9.5 %, χ²(1) = 4.66, p = 0.031
- Power 0.62 at this sample size — the panel says how many more sessions you would need for 0.80
- The same test answers “did device mix differ between variants?”
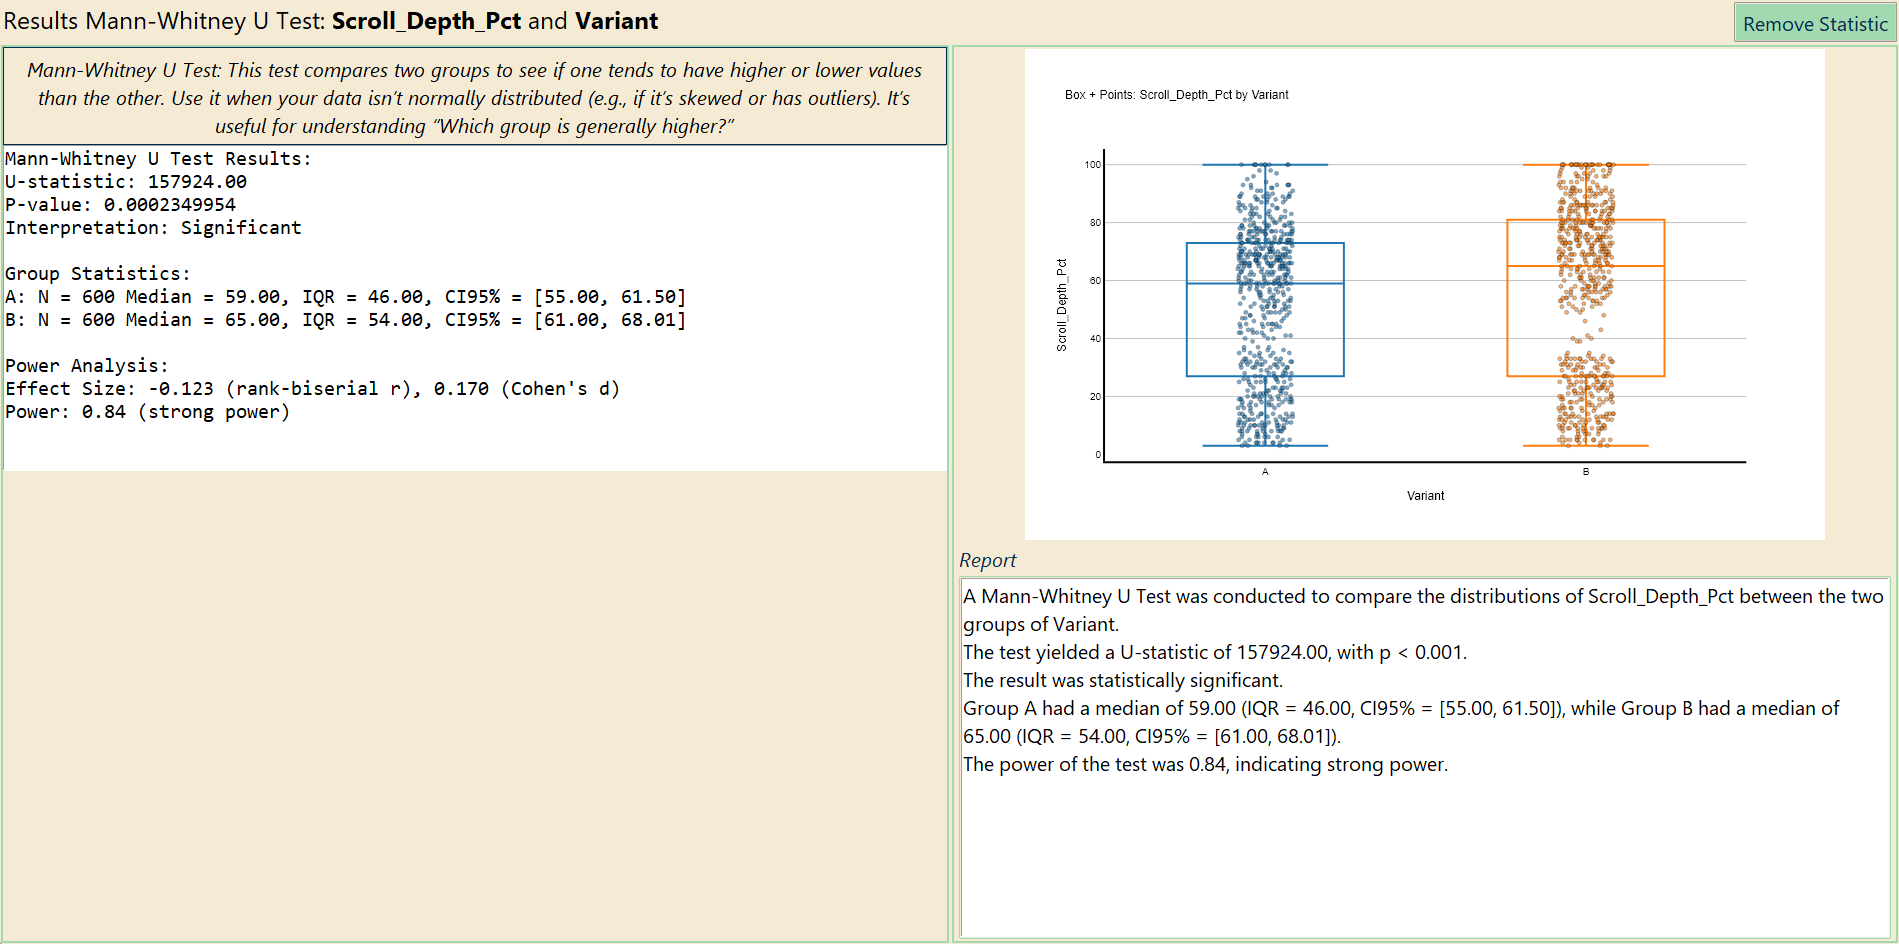
Did people read variant B further?
Scroll depth is bounded and skewed, so the t-test button turns yellow and Mann-Whitney is green. Medians, interquartile ranges, the rank-biserial effect size and a box-plot-with-points figure.
- Median scroll depth 59 % vs. 65 %, p < 0.001
- Effect size r = 0.12: real but small — say so in the report
- Time on page and revenue per session: the same two clicks
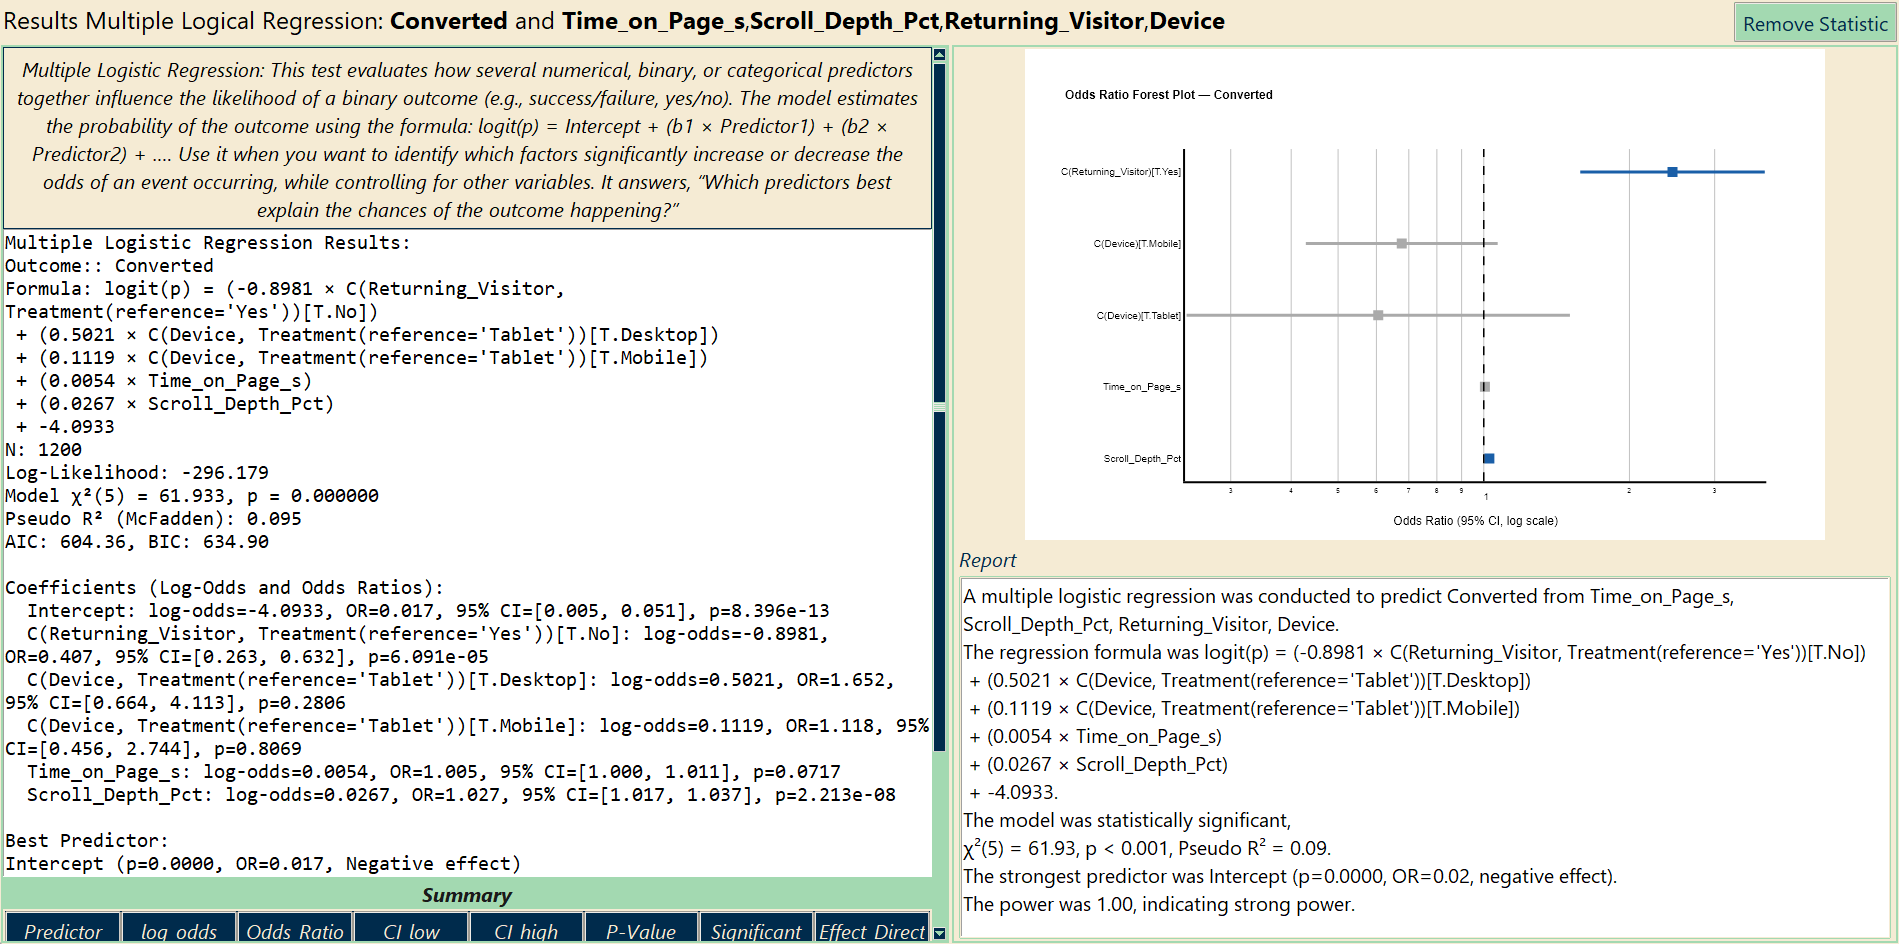
What drives conversion once you control for the segment?
Converted on time on page, scroll depth, returning visitor and device. Categorical predictors are dummy-coded automatically; the odds-ratio forest plot shows at a glance which effects cross 1.
- Each percentage point of scroll depth: OR 1.03 (p < 0.001)
- New visitors convert at 0.41× the odds of returning ones
- Device and time on page: no significant effect — the intervals include 1
Landing-page A/B test
1,200 sessions · 10 variables · fictional, computer-generated for this page · free to use in teaching and testing
Sessions randomly served variant A or B of a product page: device, country, returning visitor, time on page, pages viewed, scroll depth, conversion and revenue.
| Column | Type | Meaning |
|---|---|---|
Variant | binary | A or B |
Converted | binary | 1 = purchased |
Revenue_EUR | continuous | Order value, 0 if no purchase |
Time_on_Page_s, Scroll_Depth_Pct, Pages_Viewed | mixed | Engagement |
Device, Country, Returning_Visitor | categorical | Segments |
Reminder: every number, table and chart on this page comes from a fictional, computer-generated dataset. They demonstrate the tool, not a real result.
Also in this dataset
- ROC curve: how well does scroll depth predict a purchase, and what threshold should trigger the pop-up?
- Revenue by country: Kruskal-Wallis with Dunn post-hoc
- Conversion by variant within each device: two chi-square tests, then Holm-corrected in Multiple Comparisons
- Put the conversion bars and the forest plot side by side with the Plot Combiner
Other fields: PsychologyEducationCustomer analyticsAgriculture & biologyHR & people analytics