Did the intervention work?
Pre/post scores, two groups, a Likert questionnaire and a reviewer who wants effect sizes. StatInsight runs the test the design calls for, tells you when an assumption fails, and writes the paragraph.
Fictional data. The dataset on this page is synthetic — generated to show what the app does. It describes no real study, customers, patients or people, and the results are not findings.
The same three questions, answered in the app
Every panel below is a real result from StatInsight on the demo dataset — the text, the numbers, the chart and the report paragraph exactly as they appear on screen and in the Word export. The data behind them are fictional.
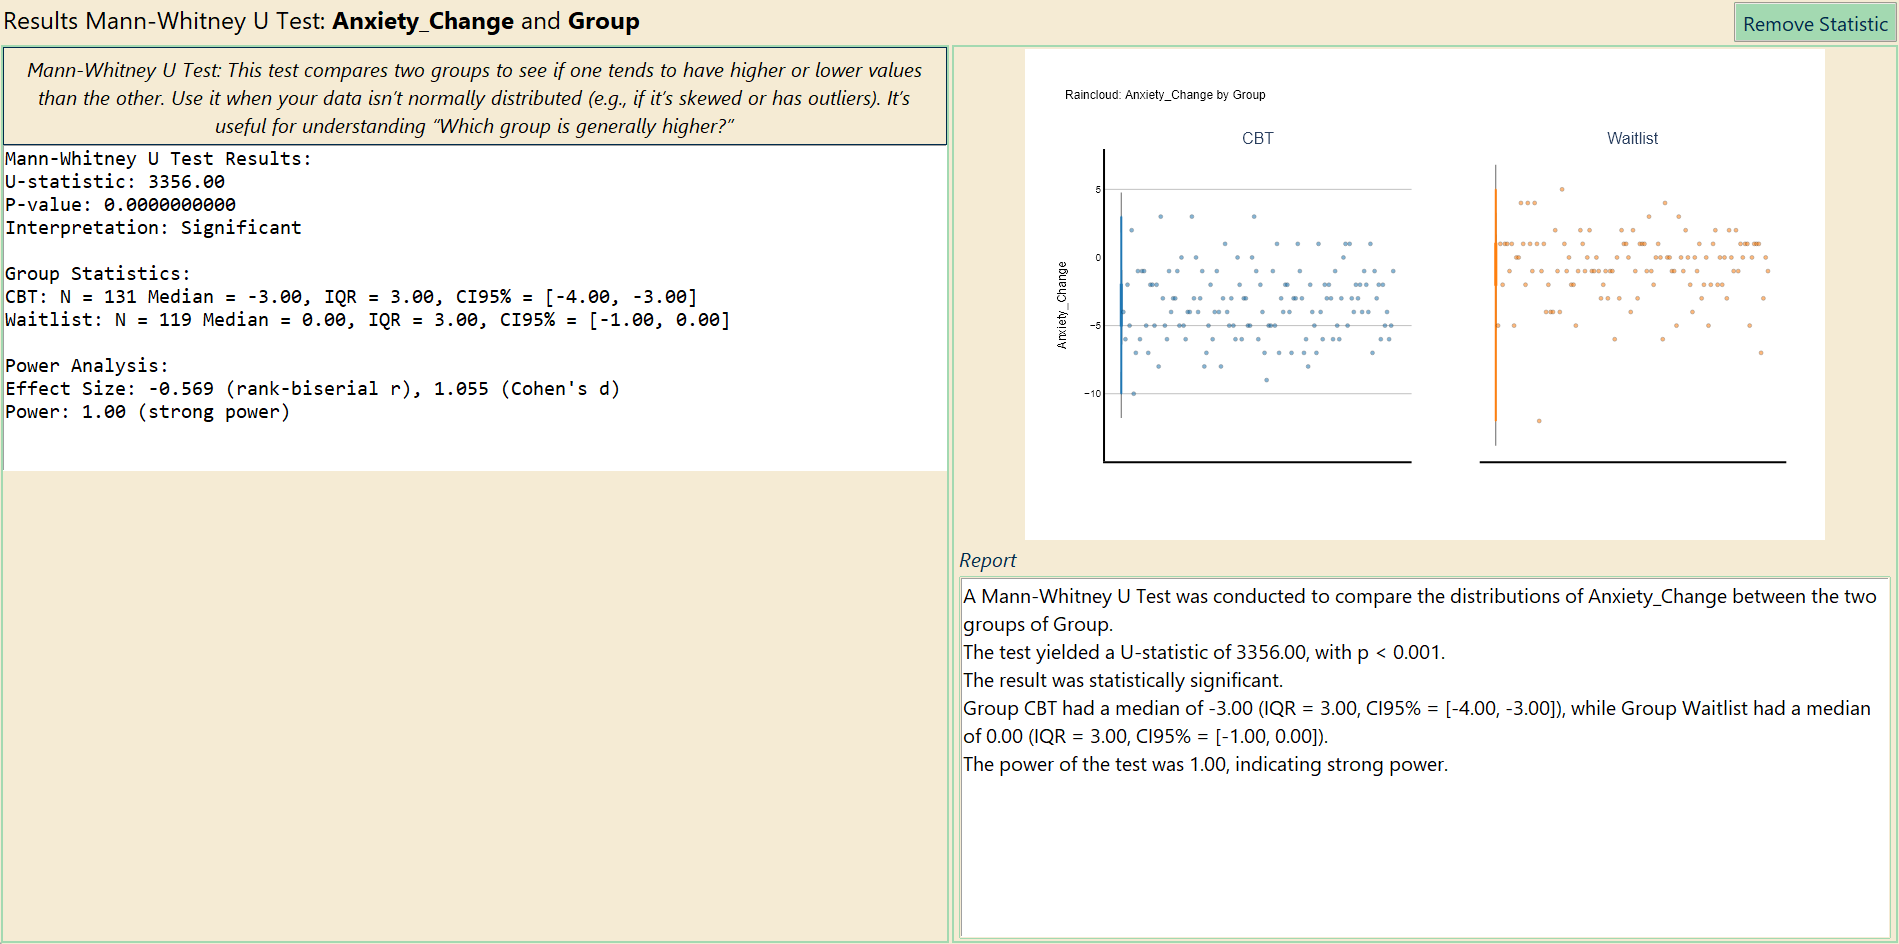
Did CBT reduce anxiety more than the waitlist?
Tick Anxiety_Change and Group. The change score is not normally distributed, so StatInsight turns the t-test button yellow and the Mann-Whitney button green — you run the right test without looking anything up. The panel shows the medians with confidence intervals, the p-value, the rank-biserial effect size and the achieved power; the raincloud plot shows every participant.
- Median change: CBT −3 points, waitlist 0; U = 3356, p < 0.001
- Rank-biserial r = −0.57 (Cohen’s d = 1.06 is reported alongside) — the effect size your reviewer asks for
- Normally distributed instead? The t-test would have been the green one
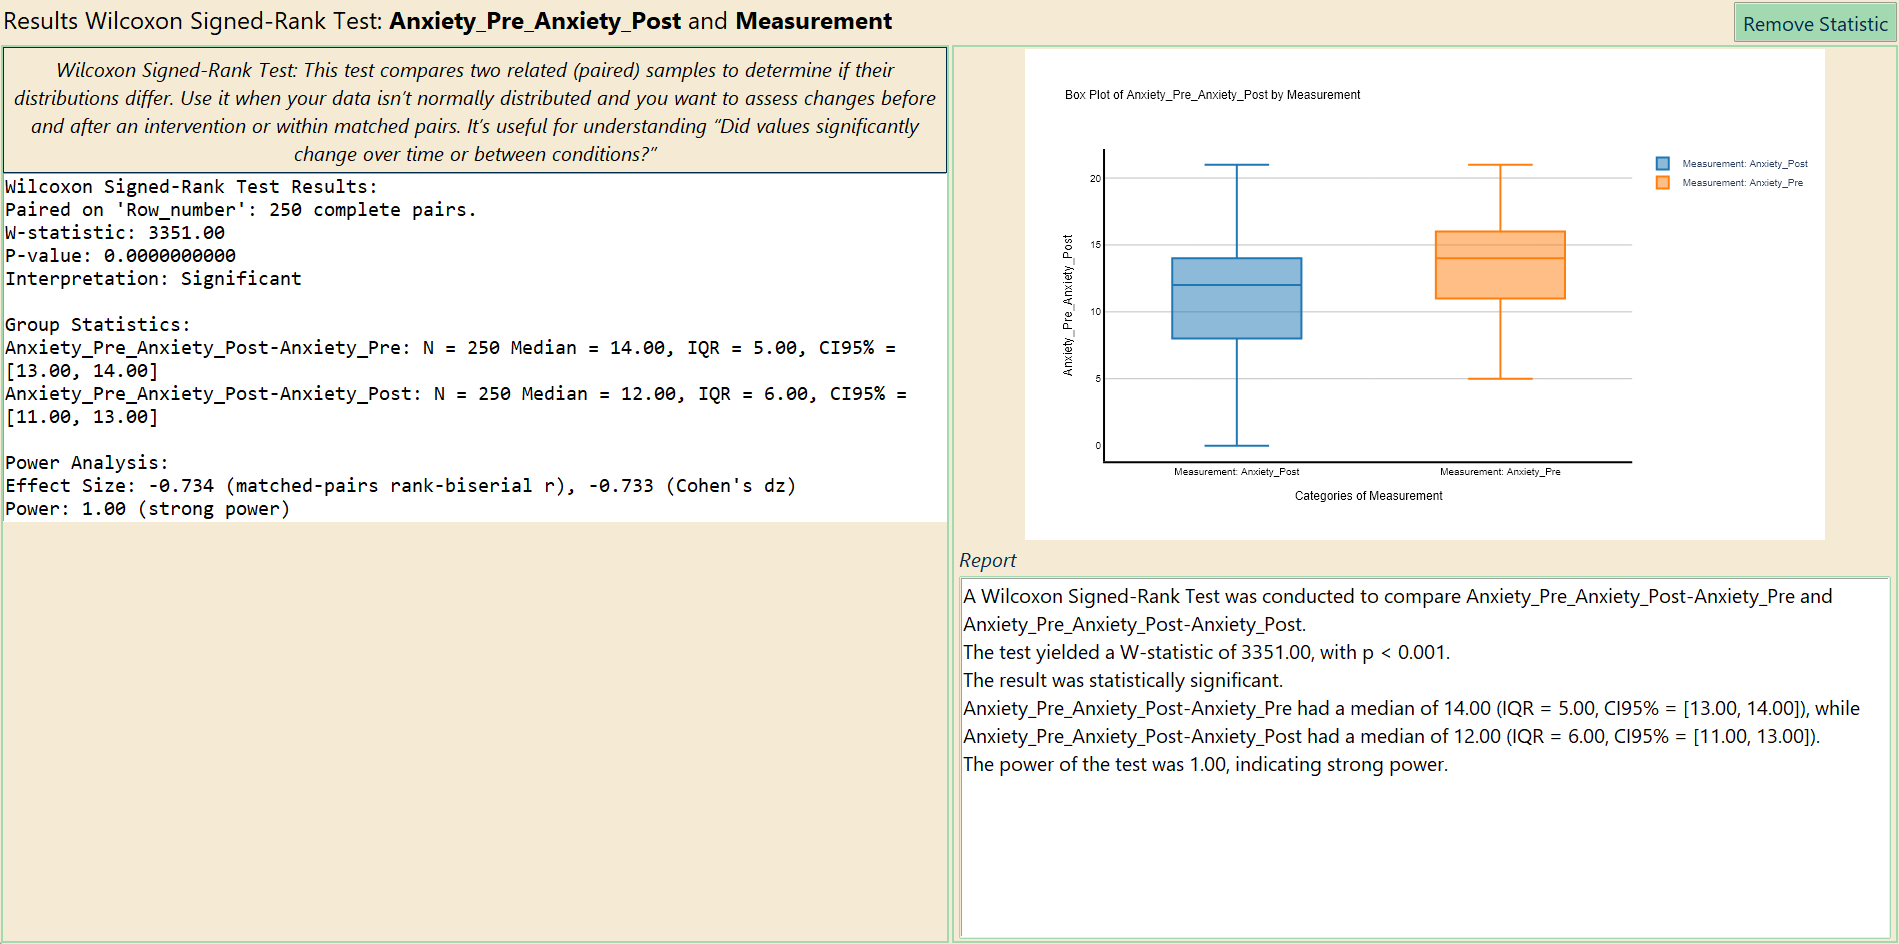
Did scores change from pre to post?
Pick the two time-point columns in the wide panel — one row per participant, one column per measurement — and StatInsight pairs them for you. Skewed change scores? The Wilcoxon test is the non-parametric partner of the paired t-test, and the matched-pairs rank-biserial effect size comes with it.
- Median 14 → 12, W = 3351, p < 0.001, r = −0.73
- Long format (a subject column and a time column) works just as well
- Three time points? Repeated-measures ANOVA and Friedman are two buttons away
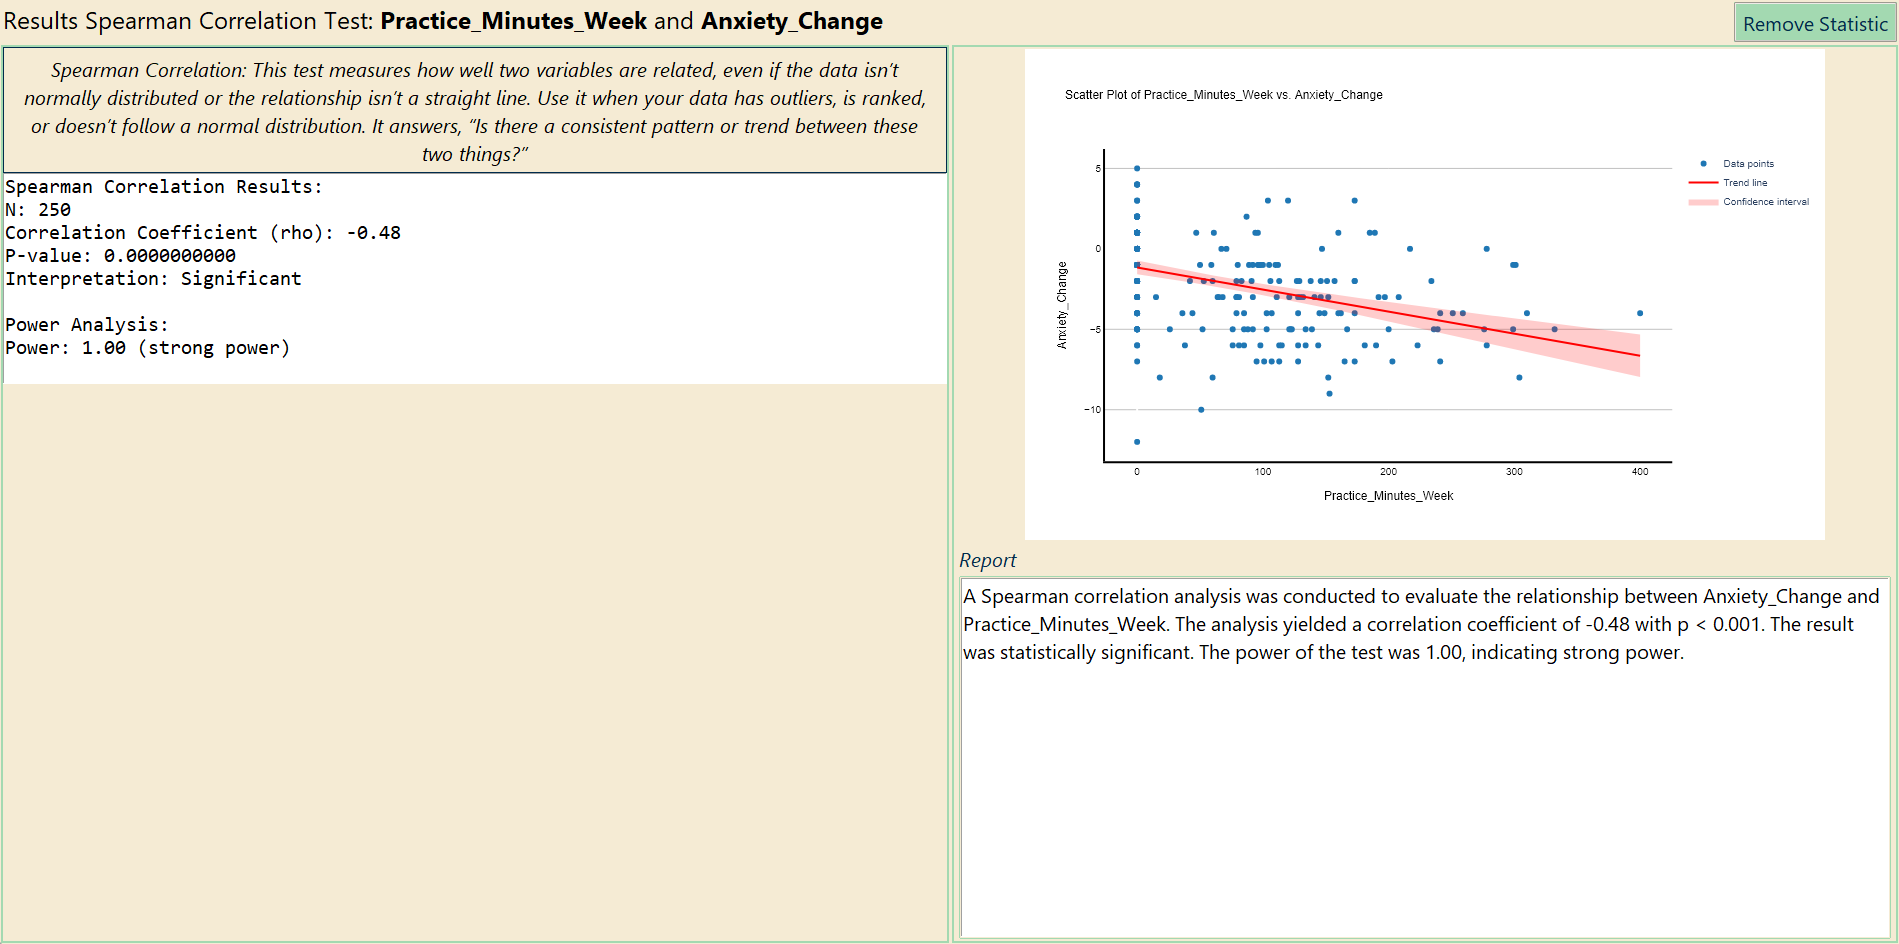
Does more home practice mean more improvement?
Practice minutes are skewed, so the Spearman button is the green one. The scatter plot with its trend line and confidence band goes straight into the Word export; switch it to a hexbin or a scatter with marginal distributions in the plot editor if the paper needs it.
- ρ = −0.48, p < 0.001: more practice, larger drop in anxiety
- Correlate one variable against all the others in one run (“multiple to one”)
- Then tick the family in Multiple Comparisons for Holm- or FDR-adjusted p-values
Anxiety intervention trial
250 participants · 13 variables · fictional, computer-generated for this page · free to use in teaching and testing
A two-arm trial: cognitive-behavioural therapy (CBT) against a waitlist. Anxiety (GAD-7, 0–21) measured before and after, attendance, home practice, sleep quality and satisfaction ratings, dropout.
| Column | Type | Meaning |
|---|---|---|
Group | categorical | CBT or Waitlist |
Anxiety_Pre, Anxiety_Post | continuous | GAD-7 score before / after (0–21) |
Anxiety_Change | continuous | Post minus pre; negative = improvement |
Sessions_Attended | categorical | 0–12 sessions (CBT arm) |
Practice_Minutes_Week | continuous | Minutes of home practice per week |
Sleep_Quality, Treatment_Satisfaction | categorical | Likert 1–5 and 1–7 |
Age, Gender, Prior_Therapy, Dropout | mixed | Covariates and attrition |
Reminder: every number, table and chart on this page comes from a fictional, computer-generated dataset. They demonstrate the tool, not a real result.
Also in this dataset
- Compare dropout between arms with a chi-square test
- Sleep quality and satisfaction (Likert) by group: Mann-Whitney or Kruskal-Wallis, with Dunn post-hoc
- ANCOVA: post-score by group, adjusted for the baseline score
- One t-test across every questionnaire scale, then Holm-corrected in the Multiple Comparisons tab
Other fields: EducationCustomer analyticsMarketingAgriculture & biologyHR & people analytics