Why are people leaving?
An HR extract with eleven columns and one question. StatInsight ranks the predictors first, then quantifies the ones that matter, and compares departments without pretending the survey scores are normal — they are not, and the app says so.
Fictional data. The dataset on this page is synthetic — generated to show what the app does. It describes no real study, customers, patients or people, and the results are not findings.
The same three questions, answered in the app
Every panel below is a real result from StatInsight on the demo dataset — the text, the numbers, the chart and the report paragraph exactly as they appear on screen and in the Word export. The data behind them are fictional.
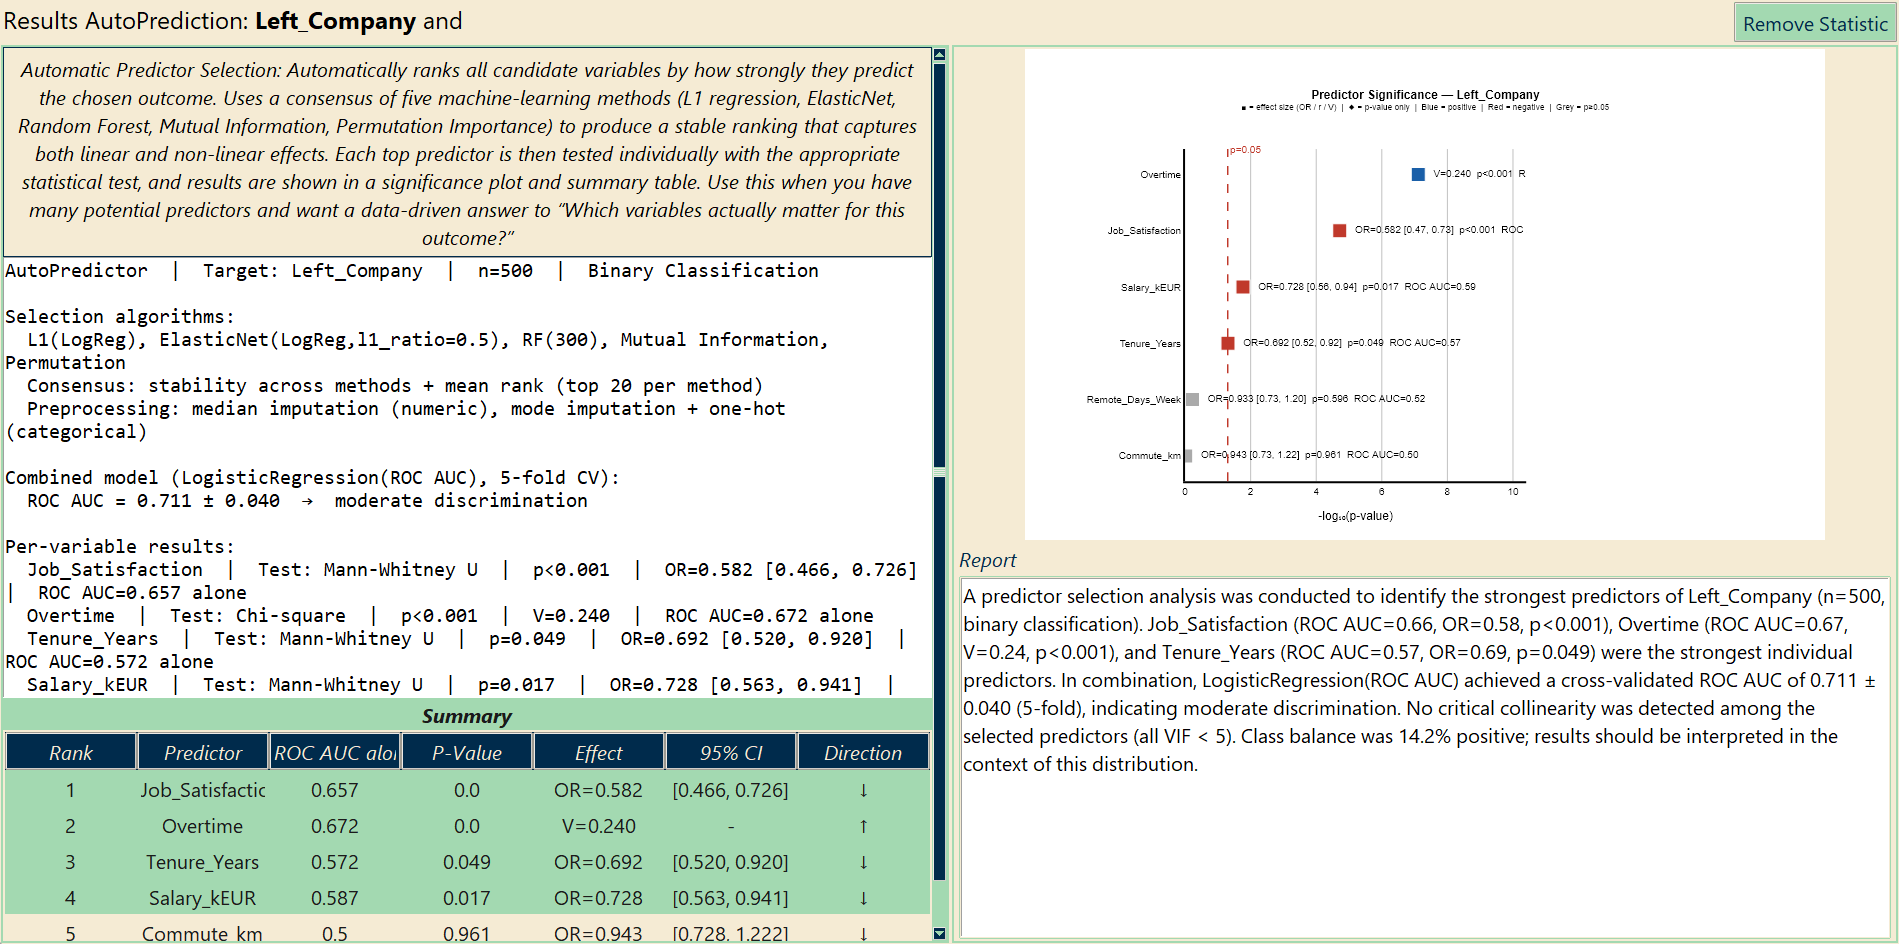
Which of these columns actually predicts attrition?
Choose the outcome, hand it every other column. Five feature-selection methods vote, each top predictor is then tested with the appropriate statistical test, and the combined model is cross-validated — so the ranking is honest, not a fit to noise.
- Overtime and job satisfaction on top (AUC 0.67 and 0.66), tenure and salary next
- Commute, age and the other columns: no detectable effect on their own
- Cross-validated ROC AUC 0.71 for the combined model
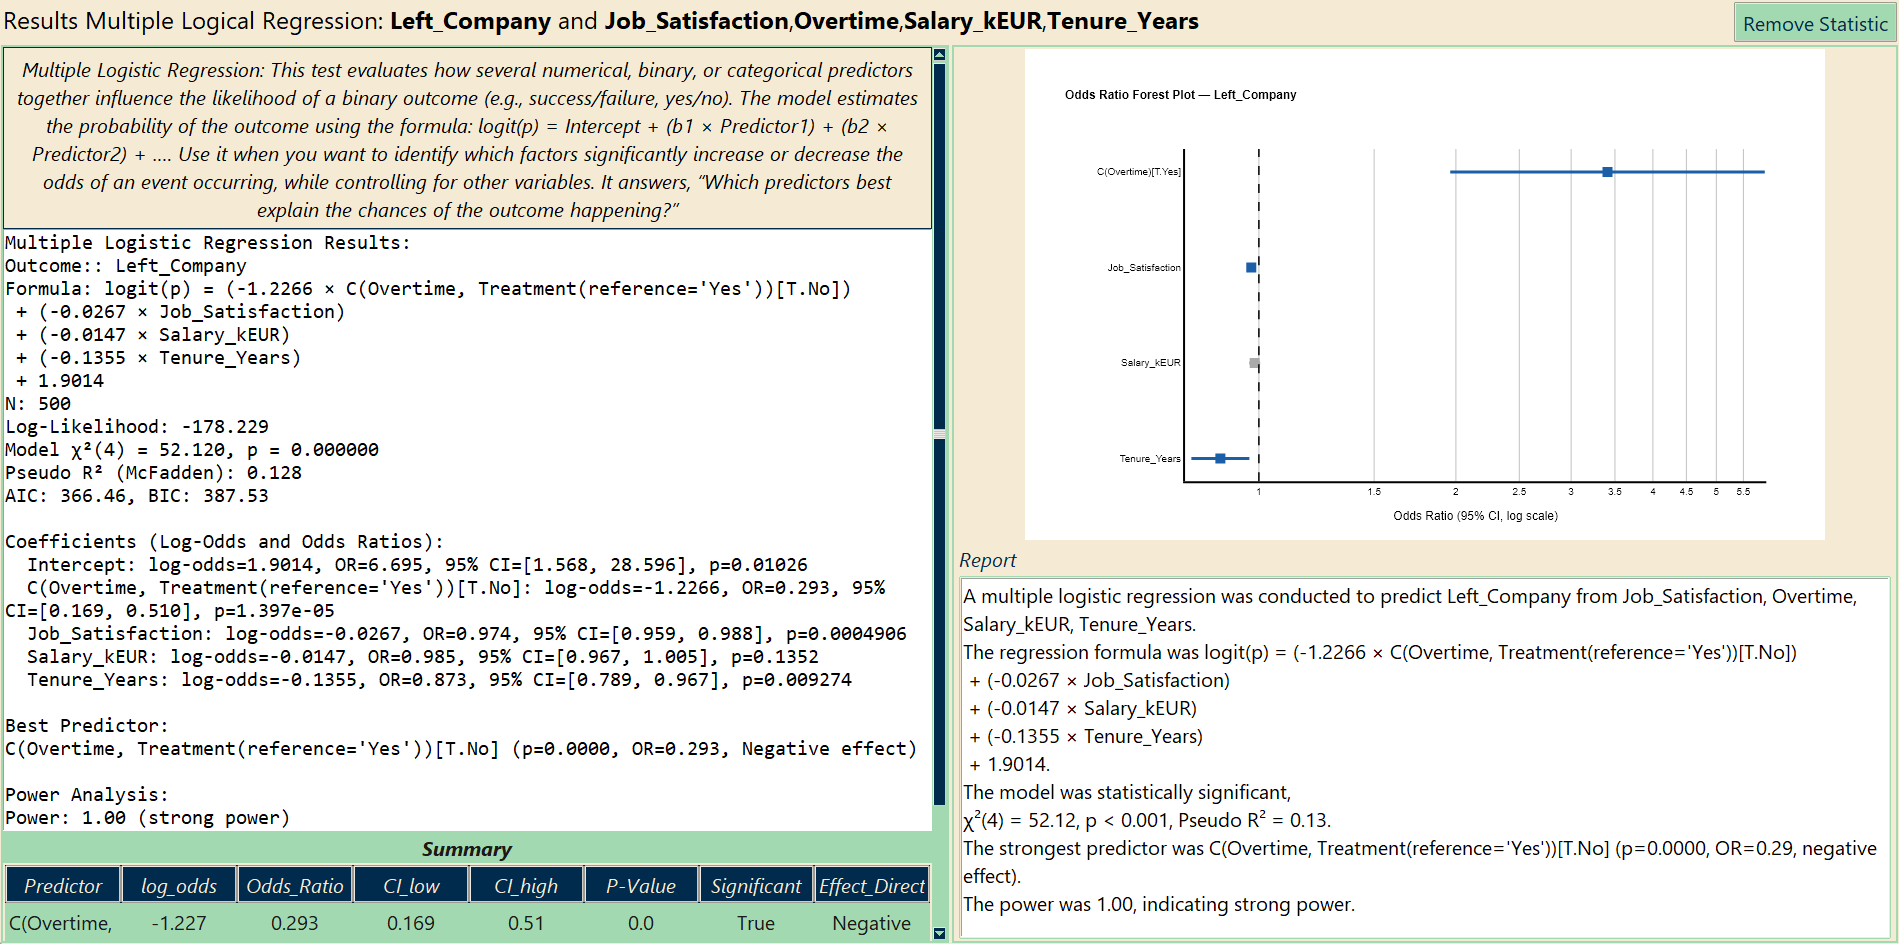
How much does overtime raise the odds of leaving?
Left on satisfaction, overtime, salary and tenure. The categorical predictor is coded automatically and reported against a reference level; the forest plot shows the odds ratios on a log scale with their intervals.
- No overtime: 0.29× the odds of leaving (p < 0.001)
- Each satisfaction point: OR 0.97 (p < 0.001); each year of tenure: OR 0.87
- Salary: not significant once the others are in the model
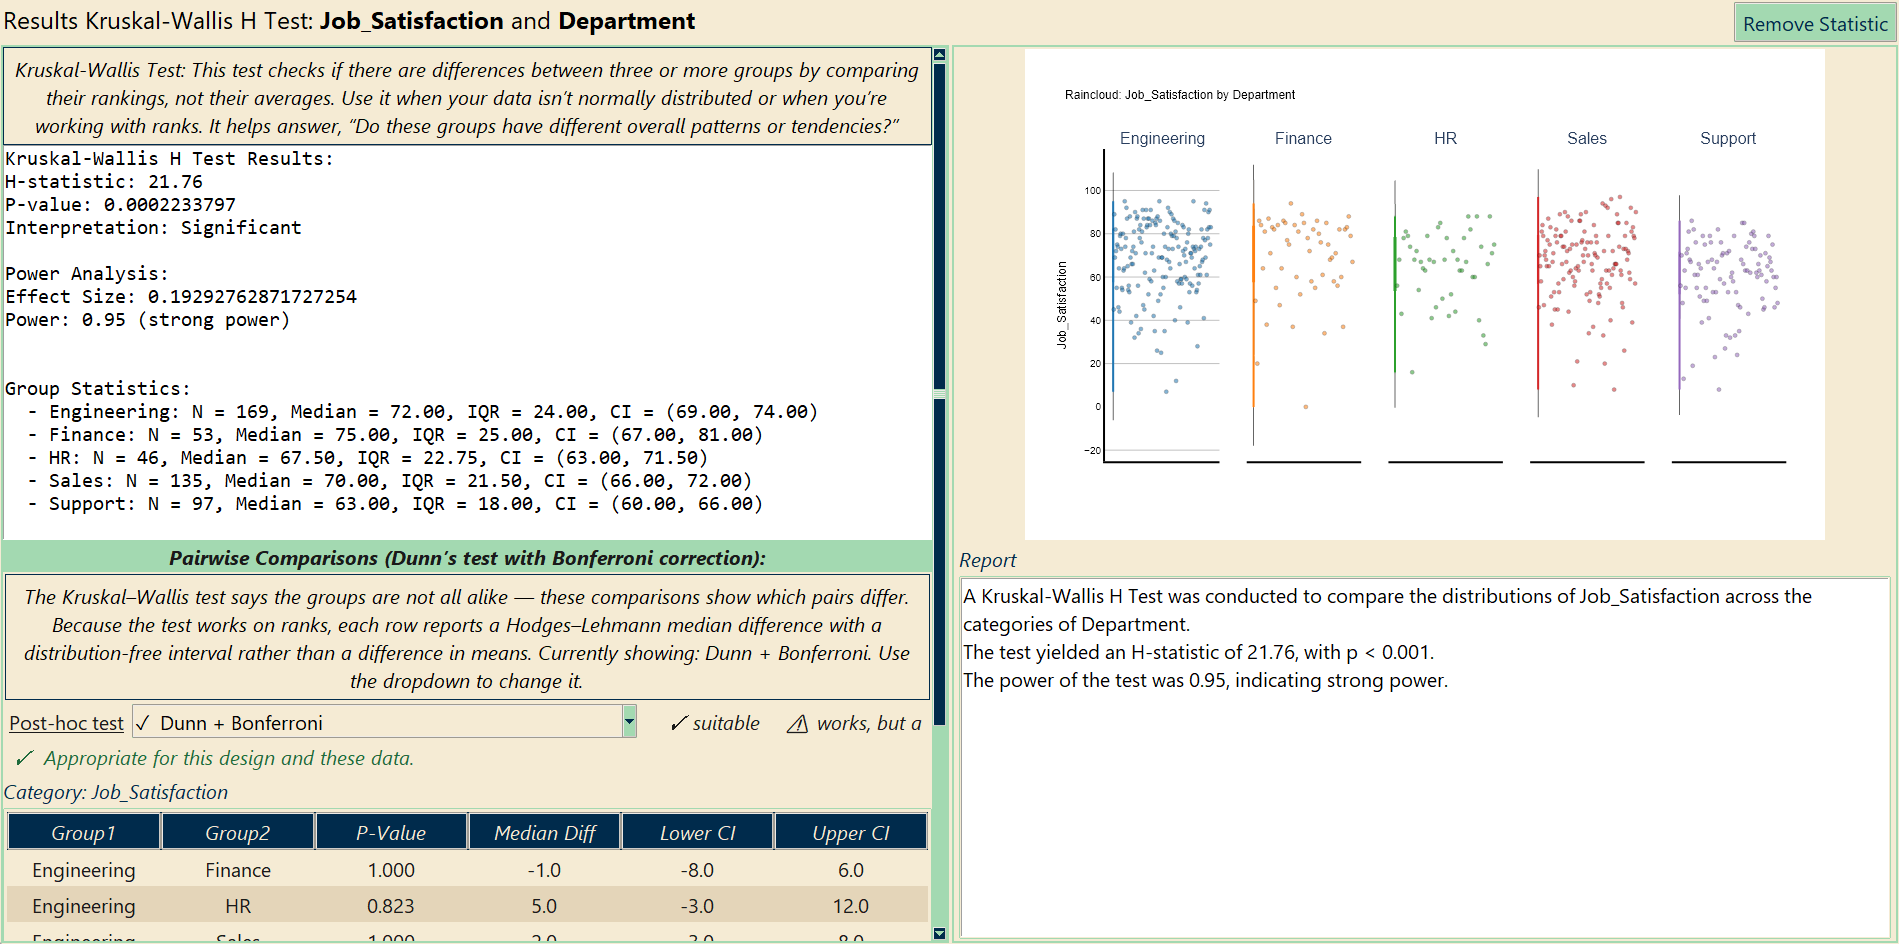
Is satisfaction lower in one department?
Survey indices are rarely normal, so the Kruskal-Wallis button is the green one. Medians per department, the H statistic, Dunn’s pairwise tests with Bonferroni correction, and a raincloud plot that shows the whole distribution per department.
- H(4) = 21.8, p < 0.001; Support median 63 vs. Engineering 72 and Finance 75
- Power 0.95 — enough responses to trust the result
- Switch to Conover-Iman or Nemenyi in the dropdown; the rows stay aligned
Employee attrition
500 employees · 11 variables · fictional, computer-generated for this page · free to use in teaching and testing
Department, age, tenure, salary, overtime, remote days, commute, a job-satisfaction index, the last performance rating and whether the employee left within the year.
| Column | Type | Meaning |
|---|---|---|
Left_Company | binary | 1 = left within the year |
Job_Satisfaction | continuous | Survey index, 0–100 |
Overtime | binary | Yes / No |
Salary_kEUR, Tenure_Years, Age, Commute_km | continuous | Numeric attributes |
Department | categorical | Sales, Engineering, Support, Finance, HR |
Remote_Days_Week, Performance_Rating | categorical | 0–5 days, 1–5 rating |
Reminder: every number, table and chart on this page comes from a fictional, computer-generated dataset. They demonstrate the tool, not a real result.
Also in this dataset
- Attrition by department: chi-square with a mosaic plot
- Does remote work protect? Left_Company by Remote_Days_Week
- Performance rating and salary: Spearman, or an ANOVA of salary by rating
- Time-to-leave with tenure and the exit flag: Kaplan-Meier by department
Other fields: PsychologyEducationCustomer analyticsMarketingAgriculture & biology